
No Netflix and Chill for Bill

Follow our Instagram page and Linkedin Page !
Hi everyone, this week Elon Musk’s Twitter takeover remains in the spotlight, while Central banks’ woes continue as inflation rises. There has also been a few interesting developments from San Francisco-based companies. Enjoy!
Pound at Lowest Level since 2020
The pound has fallen to its lowest level since 2020 as rising inflation and cost of living continue to have a damaging effect on the UK economy. Online spending has been hit particularly hard, with the Office for National Statistics reporting a 7.9% drop in online retail sales, the largest monthly fall since January 2001. Fuel sales have also fallen 3.8% following the recent all-time high prices. Economists now believe this will reduce the chances of the Bank of England’s (UK Central Bank) Monetary Policy Committee increasing interest rates by more than a quarter of a point (0.25%) in next month, as this could contribute to a further slowdown in consumer spending.

GBP/USD sinks to its lowest level in a two years, Source: TradingView
Musk reveals details of Twitter Buyout Funding

This week Elon musk has given insight into how his hostile takeover of the social media giant will be financially constructed. The package includes $25.5bn of debt, partly made up of a margin loan (a special type of loan that is intended to be invested in financial instruments), that is led by Morgan Stanley. In the SEC filing made this week Musk disclosed that he will provide $21bn of his own capital alongside this newly organised debt. Twitter have chosen JPMorgan Chase and Goldman Sachs to advise them on the deal. The Twitter board last week complicated Musk’s attempts to takeover the social media giant and it is likely that they will have more tricks up their sleeve in the coming weeks.
US Inflation Expectations Jump
The 10-year break even rate (measure of investor market inflation expectations for the next 10 years) has jumped to its highest level in decades, despite the Federal Reserve stating that aggressive monetary policy intervention is near. This comes after the Fed chair Jay Powell stated in a meeting of the International Monetary Fund (IMF) this week that “it is appropriate in my view to be moving a little more quickly”. This rise in the break-even rate tells us that investors do not have faith in the Fed to be able to control prices, with the Annual Inflation rate climbing to 8.5% in March.

Stripe steps into Crypto
Stripe, the Fintech/Payment-processing company founded by two Irish brothers John and Patrick Collison, has stepped into the Crypto world by offering a product that allows companies to pay their employees using cryptocurrency. Stripe is the first company to implement this product, which will give employees the option to be paid in the Stable coin ‘USDC’, which is backed by the US dollar. Stripe’s last interaction with Crypto was 4 years ago when they offered support for Bitcoin, but then soon after stopped accepting Bitcoin payments due to its volatile pricing and inefficiency in everyday use. But now the $95bn fintech group has moved back to the crypto space following the increasing hype around ‘Web3’.
No Netflix and chill for Bill Ackman
Billionaire investor Bill Ackman has sold his stake in streaming giant Netflix at a $400mn loss, just a few months after acquiring it for $1.1bn. The loss came in a panic-filled 24 hours for Netflix investors as the company announced that its subscribers were declining, resulting in the company losing 40% of its market value, equivalent to $60bn. In late January, Pershing Square (Ackman’s Hedge Fund) acquired 3.1mn shares of the company, stating at the time he was focused on Netflix’s long-term horizon, but this clearly hasn’t turned out to be the case. I’m now feeling a lot better about the fiver I lost at the races last week!
See you next week,
Patrick
Short-term Bitcoin Reversal Trade
While Bitcoin may be one of the most volatile and risky assets out there for trading, in my opinion, it is one of the best assets at obeying technical analysis indicators, at least the ones I prefer to use. It is also the only cryptocurrency I chose to trade as the price direction of altcoins is largely determined by that of Bitcoin due to its overall dominance and influence over the crypto market. In this week’s article, I am going to walk you through a trade setup for a long position on Bitcoin that I entered on Monday evening which I plan on holding for a maximum of 1-2 weeks. Please be aware that risk management is essential when trading such short-term moves. My main goal with trades like these is to practice with profit being a bonus so only a small amount of capital is committed per trade.
Before every trade, a strong conviction must be acquired so that the trade makes sense and has a high probability of playing out. This means building a case on multiple time frames that argue for your strategy being successful. No matter the time horizon of the trade, it is important to have a strong long, medium, and short-term conviction.
Long/medium term macro conviction
I believe Bitcoin has grown to trade as a digital global macro asset that is highly sensitive to alterations in investor risk sentiment, dollar strength, and overall market liquidity. I am therefore very impressed with how well it has held up in the recent hostile macro environment. The past few weeks have seen the market deal with pricing in 2 consecutive 50bps rate hikes from the Fed as well as the possibility of balance sheet run-off (quantitative tightening) commencing, yet Bitcoin currently sits just above $40k. This is probably due to most of the Fed’s hawkish pivot having already been priced into the crypto markets during Bitcoin’s violent 50% decline from its all-time high in November 2021 to the low in early January. Bitcoin’s price resilience to these further hawkish developments provides a solid foundation for the conviction required in taking on this risky long position.
Medium-term technical conviction
The cryptocurrency market has been rather stagnant and boring lately, with Bitcoin being effectively range-bound in an upward trending price channel between the mid $30-40k region since the start of the year. However, if the turning points (or reversals) at the bottom and top end of these ranges (Purple lines below) can be successfully determined, they can provide very profitable trading opportunities. The black horizontal lines also indicate significant support and resistance levels (see this article for a full explanation).

Bitcoin on a 1 day chart, trading in a channel, Source: TradingView
Price hasn’t retreated to the bottom of the channel, however strong signs of a reversal on the daily chart indicate that lower channel prices may not be met. The first is a bullish engulfing candle which greatly adds to trade conviction as Bitcoin tends to strongly react to bullish engulfing candles. The help of another of my favourite reversal indicators was needed to fully solidify the medium-term technical conviction.
Relative Strength Index (RSI) – Divergences

The RSI is a popular momentum indicator that provides traders an idea of how ‘overbought’ or ‘oversold’ an asset is. If RSI is above 70 (see bottom of chart above), it is overbought and if it is below 30 it is oversold. Therefore, this tends to be a signal of a coming reversal in price, as the stock has either fallen or risen too quickly. Bullish divergence occurs when the RSI makes a new higher high, but the price makes a new lower low. This indicates rising underlying momentum in the stock (i.e. investors are buying the stock, but it is not yet reflected in the stock price). This could indicate the beginning of a new uptrend in price. The most recent bullish divergence being confirmed with the bullish engulfing candle is significant and strengthens the medium-term technical conviction for the trade.
I gained further confidence in this trade when the price successfully bounce off the key support level at $39,600 multiple times.
Short term conviction and risk management
The multiple bounces off the $39,600 support level are what initially drew my attention to a possible reversal trade in Bitcoin. Over the Easter weekend, I began to focus my analysis on shorter time frames to monitor reactions around the $39,600 support zone, mainly the 1Hour (1H) timeframe, as shown in the chart below. A support/resistance zone is very similar to a support/resistance level and is useful when visualizing demand/supply areas where price may not have previously reacted to the exact same price level, but a number of levels very close together. This is especially prevalent at shorter time frames where many previous candles have reacted to the purple zone shown below.
Trading was incredibly dull over the weekend however volatility entered the market as soon as the CME (Chicago Mercantile Exchange) Futures market opened late Sunday evening and the market violently broke through the support zone. However downward pressure soon subsided and the price retraced back into the support zone. It became apparent that a false break of the support zone with a V shape recovery could be in play should sufficient volume come into the market to propel price through the zone.
Trade volume is essential with any reversal trade as it shows market participants are confident that a momentum shift in price is imminent and lo and behold a huge spike in volume came with the 18:00 1H candle with a sharp breakthrough the support zone and I entered the trade soon thereafter. More on trade execution next week.
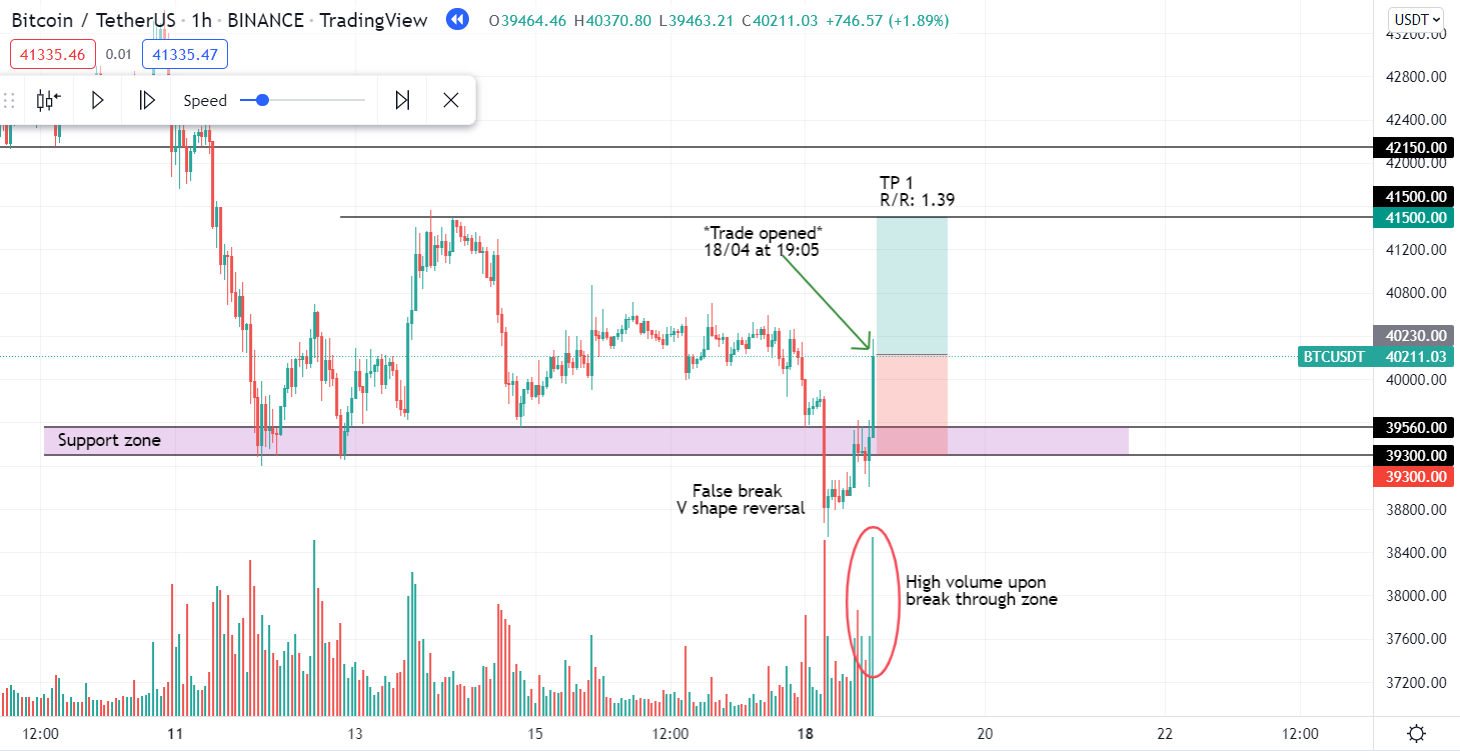
Risk management is vital when trading and involves carefully deciding on; where to set a stop-loss (bottom of red shaded area) should you be proved incorrect; and profit targets (top of green shaded area) while strictly adhering to them. Stop losses are extremely important as they limit the loss on your trade if it doesn’t play out as expected. Take-profit targets are also incredibly important as they help you refrain from holding a trade for too long, and so lock in your gains. They both benefit you because the market is very unpredictable, especially in these shorter time frames. They also mean that you do not have to be constantly monitoring your trade looking for exits, thus mitigating psychological errors and emotional trading, the worst thing for any market participant!
The setup for the trade is summarised below as well as on the up-to-date 1H chart below.
Entry price: $40,240
Stop loss: $39,300 initially, now moved to entry price after TP 2
Take Profits:
TP 1: $41,500 (Close 10% of the trade)*
TP 2: $42,150 (Close 20% of the trade)*
TP 3: $44,400 (Close 50%)
TP 4: $46,800 (Close remaining 20%)
(* price target already met)
Stop losses and take profits are always placed at significant support and resistance levels. The stop loss for this trade was initially placed at the bottom of the support zone then moved to the top of the support zone after the first take profit was met, then moved to the entry price after the second take profit was met. This means that my trade is now running with zero risk. The take profits left are just below key resistance levels to ensure profit is secured even if the price does not reach the resistance level exactly.

I will write more about risk management in future articles, such as risk/reward ratios, as well as trading psychology, one of the most important things for any trader! I Hope you enjoyed this week’s article, see you next time!
Ronan
Disclaimer
This communication is for informational and educational purposes only and should not be taken nor used as investment advice, as a personal recommendation, or solicitation to buy or sell any financial instrument. This material has been prepared without considering any particular recipient’s investment objectives or financial situation and has not been prepared in accordance with the legal and regulatory requirements to promote independent research. Any references to past or future performance of a financial instrument, index or structured product are not, and should not be taken as, a reliable indicator of future performance. I assume no liability as to the accuracy or completeness of the content of this publication.