
S&P 500 to 5000?

This week we witnessed further Russian sanctions as well as an interesting new shareholder in Twitter. There has also been major development on how the US will tackle the current inflation crisis, as well as a new valuation of one of the major crypto exchanges. Enjoy!
Brussels to ban Russian Coal

The EU have announced further sanctions on Russia this week, including the import of coal as well as the ban of Russian and Belarusian road transport operators, which will greatly hinder Russia’s industrial power. Russia currently accounts for 70% of EU thermal coal imports, so these sanctions will likely drive energy prices even higher in Europe. Hopefully the impacts of such price increases on the economy will be partially offset by rising temperatures as we enter the summer months.
Russia forced to pay Eurobonds in roubles
The Russian ministry of finance has been forced to pay interest on dollar-denominated Eurobonds in roubles following the US government’s decision to ban US banks from handling dollars coming from Russia. Rating agency Fitch previously said that if Russia begins to pay dollar interest payments in Roubles, then “a default or default like process has begun”. A spokesperson from the Kremlin has said that there is no basis for a ‘real’ default on interest payments by Russia given that they have more than enough foreign account cash to cover it, but these funds are currently frozen due to previous sanctions.
Binance is booming

The US arm of Binance, the world’s largest crypto exchange by volume, has been valued at $4.5bn in its first round of fundraising. This is just half of what their main competitor, FTX, was valued at in January – a whopping $8bn. US regulators have tightened their eye on crypto platforms over the last few months, with lots of new regulations being released. As a result, many crypto exchanges have launched individual US platforms to comply with such regulations. The chief executive of Binance US has said that their lower valuation is due to a limited selection of products, which they aim to improve upon with the increased funding they have received.
Twitter gets a Musk-Over
An SEC filing this week revealed that Elon musk has become the biggest shareholder in social media giant Twitter, taking a 9.2% stake in the company. Musk is also set to take a position on the board of directors, with many assuming that his aims are to reduce the amount of regulation on Twitter. He has previously put pressure on Twitter to return to its early days of free speech and relax its content moderation policies, and now he is in a much better place to try and make this happen.
Fed to slash balance sheet

Fed total assets, Source: FRED
The Federal Reserve (Fed) is set to begin a quantitative tightening (QT) agenda that will cut $95bn of assets per month from its huge $9tn balance sheet. This is believed to be beginning as early as next month, as the Fed aims to counter the alarmingly high inflation rates that we have witnessed so far this year. The Fed’s presence in debt markets grew massively during the pandemic as they tried to ward off an economic downturn, but Fed Chair Jay Powell has decided that the pandemic printing has caught up to them, and now is the time to reverse these measures. The $95bn cut p/m is broken up into $60bn of treasuries and $35bn of mortgage-backed securities.
Why I am short-term bullish on the US stock market – Part 2
Global market sentiment has become incredibly negative in recent months and that is certainly understandable given that we are currently in one of the most uncertain macroeconomic environments in recent history with frightening ongoing developments such as:
· The hottest inflation figures in 4 decades
· The most hawkish Federal Reserve in 4 decades
· The worst European war since WWII
· The looming threat of stagflation
· Energy markets on the verge of a crisis
Many are looking at headlines like these and are calling for the impending end of this economic cycle with a recession at the end of this year or the first half of 2023. I do agree with this argument to a certain extent as the slowdown in GDP growth has led to an inverted yield curve, one indicator that a recession is just around the corner.
However, in this article, I am going to put forward some fundamental arguments that have led me to believe that the coming 3 to 6 months will see positive returns and trading opportunities for the S&P500. These arguments will go in tandem with the technical analysis points I made in last week’s article.
Fund manager cash levels
Fund managers are holding the highest level of cash alongside their portfolios since April 2020 as shown in the Bank of America’s Fund Manager survey below. This risk-off move came as a result of the high levels of uncertainty in financial markets in the past few months. The growing geopolitical tensions and direction of inflation, which affects central bank policy decisions, are now worrying asset managers. Once these uncertainties become clearer e.g. Russian ceasefires beginning this week, this cash could be used to fuel a substantial flow of liquidity into equity markets. The encircled periods of peak cash levels below such as June 2012 and October 2016 saw substantial positive returns in the proceeding months.

Cash as percentage of assets under management held by find managers, Source: BofA Survey
Investor sentiment shift
Secondly, investors risk appetite retreated to its lowest levels since the 2020 COVID crash in February, indicating high levels of fear and bearish sentiment across the markets. The Goldman Sachs Risk Appetite indicator below has reversed from these low levels in March and indicates that we are potentially going through a major sentiment shift from fear to greed. A euphoric equity market with strong upward price moves is of course a byproduct of this momentum shift towards greed and with fund managers holding high levels of cash, there is plenty of liquidity to fuel this move.
Most of the fear in the market over the past six months was driven by the movements of inflation and the Federal Reserve’s hawkish tilt on monetary policy since September 2021, causing investors to worry about a slowdown in economic growth. However, investors have had months to react to this and have already priced in seven interest rate hikes for 2022, made evident by the fact that the week of the first-rate hike we witnessed a bullish engulfing candle, something I alluded to last week. This suggests a shift from fear to greed is indeed beginning.

Risk appetite rising, Source: GS
Yield Curve Inversion
For my final argument, I will be discussing the yield curve, which is a graphical representation of yields on US Treasury bonds (debt) across each of its maturity durations. For example, when I refer to the 10yr, I am referring to the yield on a US Treasury bond that matures in 10 years. Also, a spread is the difference between the yields of two maturities e.g. the 10y2y spread is the difference between the 10 year and 2-year yields. In particular, I will be talking about yield curve inversions that are occurring on spreads such as the 10y2y and why I believe they are not a risk to the S&P in the coming months.
A yield curve inversion occurs when the yield on short-term bonds rises higher than those on longer-term bonds. This has proven to be a powerful “recession predictor” in the past, with the 10yr-2yr spread preceding every recession since the 60s. This is why the move to inversion has been such a hot topic of late, as investors worry about stagflation and the end of the economic cycle. However, in terms of my short-term time horizon, I don’t think we should be too worried.
Firstly, there is always a substantial time lag between the 10yr-2yr inverting and a recession, as seen in the chart below. The spread has barely dipped below zero and if it does begin a prolonged period of inversion, a recession may still be another 9-24 months away. Investors would be far too early if they pull out of the markets now.
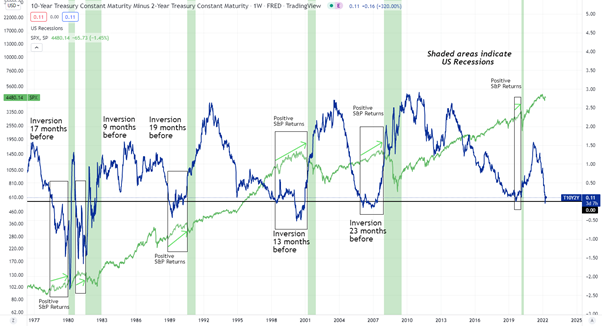
Yield curve inversions are an indication of recession but could be some time away, Source: TradingView
Secondly, during these periods between inversion and recession the S&P500 has historically seen incredible returns as seen in the chart below for the 6 most recent inversions (19’ inversion was very brief but still resulted in positive returns before the shorted recession in the US history). For example, from the Jan 2006 inversion of the 10yr-2yr to the market top in Oct 2007 the S&P saw a massive 30% move. It is also worth mentioning that during each of these inversions, the Fed was hiking interest rates. Therefore, it would be “routine” if we see strong returns in the short term for the S&P, alongside rate hikes and a yield curve inversion.
Finally, some economists argue that the 10year - 3month spread inversion is also an accurate recession indicator, having preceded the previous 4 recessions. If this is the case then a recession may be a lot further away than the 10yr-2yr may suggest, as this spread is not even close to inversion (see chart below).

Is a relief rally coming?, Source: TradingView
However, most asset managers choose the 10yr - 2yr over the 10yr - 3mth spread as a recession indicator since the 3mth contract is not a long enough duration to account for an incoming hiking cycle (which usually lasts 2-5 years) and as the current hiking cycle has just begun the 10yr - 3mth has not fallen like the 10yr - 2yr has. Therefore, as the Fed continues its rate hikes, the 10yr - 3mth spread may begin to narrow, so this is something to monitor over the coming months.
Of course, there is always the risk that this time is different, and it may be, with the rampant inflation and the Fed’s plans for the steepest rate hiking cycle in 40 years. It is vital to keep an open mind and be willing to change your view when the facts change during these strange and unpredictable times.
See you in two weeks!
Patrick & Ronan
Disclaimer
This communication is for informational and educational purposes only and should not be taken nor used as investment advice, as a personal recommendation, or solicitation to buy or sell any financial instrument. This material has been prepared without considering any particular recipient’s investment objectives or financial situation and has not been prepared in accordance with the legal and regulatory requirements to promote independent research. Any references to past or future performance of a financial instrument, index or structured product are not, and should not be taken as, a reliable indicator of future performance. I assume no liability as to the accuracy or completeness of the content of this publication.